If you’ve never really paid much attention to the TQI data before, it can be difficult or confusing to understand.
The first thing to remember is that TQI is all about vehicle failure data. It doesn’t take into account vehicles that you have passed, only vehicles that you have failed. To provide a bit more context, we’ve provided an example below:
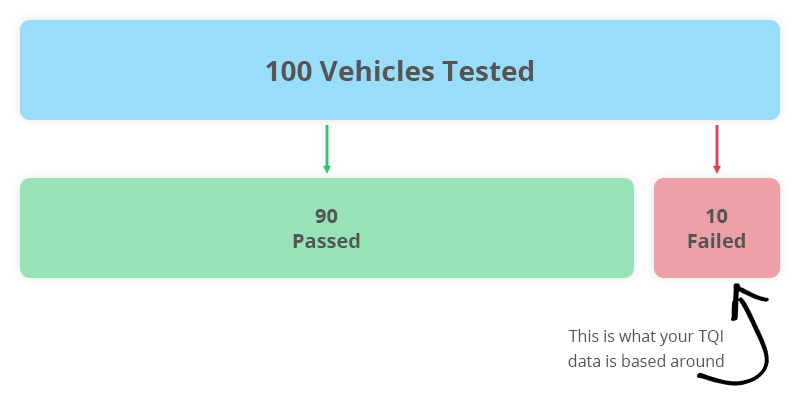
Joe Bloggs tests 100 vehicles in May 2024. From 1st June 2024, his TQI data is available to review his failures for May 2024.
The TQI data shows that 100 vehicles were tested and 10 of these were failed. Joe therefore has a total failure rate in May 2024 of 10%. All the TQI data will be based around the 10 vehicles that failed, not the 100 vehicles that were tested.
Visualising the failure rates
Joe failed 2 of the 10 vehicles on brakes. His TQI data will therefore show a failure rate of 20% for brakes.
 Of the 10 that Joe failed in May, 2 of them failed on brakes. 2 out of 10 = 20%.
Joe failed 8 of the 10 vehicles on suspension. His TQI data will therefore show a failure rate of 80% for suspension.
 Of the 10 that Joe failed in May, 8 of them failed on brakes. 8 out of 10 = 80%.
As another example, if in a month Joe Bloggs only failed 1 vehicle and it failed on brakes as well as suspension, the TQI data will show 100% on brakes and 100% on suspension.